I took some time to remedy this on my own by trying to self-study out of Rivest, et al., but while trying to do so I found that the mathematical foundation that I'd retained from my academic years was lacking. Some of that could be blamed on the academic institutions, as not all of my teachers were great and inspiring, while other times it could be blamed on myself, as I tended to put more thought into women than mathematical truth during my teenage years. Regardless of how I'd gotten there it became clear to me that I needed some kind of refresher in order to fill in the gaps left by my teachers and me, which meant I had to come up with some kind of plan.
The translation that I chose to read was Thomas L. Heath's translation. Given my current time-management system it would have been impractical to tackle all of "Elements" in one go, thus I divvied it up into four sections: 1) books I to V, 2) books VI - IX, 3) book X, and 4) books XI - XIII. As you may have surmised from the title, this blog covers only the first section.
The material of these first five books felt in many ways like a refresher of high school geometry, except without the sleep-inducing monotone of my teacher that year. However, the material also felt more mature, like a college course; as I recall, fewer things were proven in high school and more was asserted, this created a more disjoint effect than Euclid, who started with a few simple premises and then continuously built upon them. As with most books, the language has taken a bit of getting used to; the algebraic form of math which I am accustomed to was likely not developed when "Elements" was written, but the diagrams with every proposition more than made up for the unfamiliar vernacular.
Thus, since AC is equal to AD,the angle ACD is also equal to the angle ADC;
therefore the angle ADC is greater than the angle DCB;
therefore the angle CDB is much greater than the angle DCB.
What wasn't clear to me was how, exactly, ADC was bigger than DCB. The answer in this case was the unstated assumption that "the part is greater than the whole"; looking at the diagram I was supposed to have noticed how the angle DCB was within the angle ACD, therefore DCB was less than ACD and, since ADC was proven equal to ACD, DCB was thus also less than ADC. This confused me because, at this point, I was not yet sure whether to treat the diagram as part of the proposition and thus containing information perhaps not explicitly stated or as an auxiliary piece of information to help visualize the proposition. Given the proposition so far, one could construct an alternate diagram as follows:
![\fbox{
\begin{tikzpicture}
\coordinate [label=left:A] (A) at (0, 0);
\coordina...
...D);
\draw (B) -- (C);
\draw (B) -- (D);
\draw (C) -- (D);
\end{tikzpicture}}](img13.svg)
![\fbox{
\begin{tikzpicture}
\coordinate [label=225:B] (B) at (0, 0);
\coordinat...
...;
\draw (A) -- (A \vert- D) coordinate [label=below:L] (L);
\end{tikzpicture}}](img14.svg)
![\fbox{
\begin{tikzpicture}
\coordinate [label=above:B] (B) at (0, 2);
\coordin...
...ill=white,inner sep=0.5pt,anchor=335]165:H}] (H) at (245:2);
\end{tikzpicture}}](img15.svg)
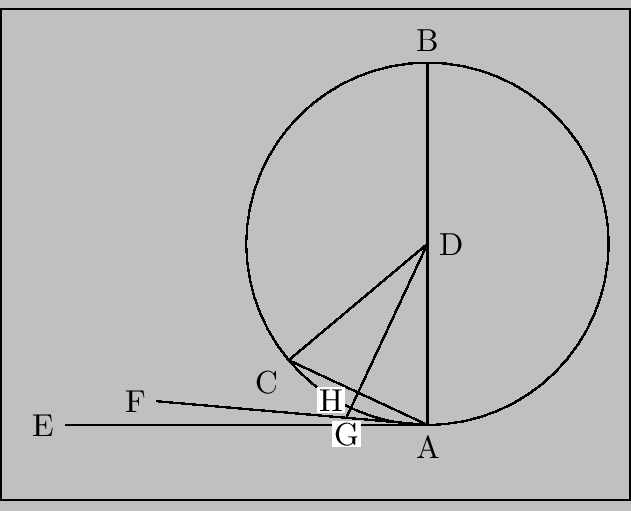
I say further that the angle of the semicircle contained by the straight line BA and the circumference CHA is greater than any acute rectilineal angle, and the remaining angle contained by the circumference CHA and the straight line AE is less than any acute rectilineal angle.
Not sure what Euclid meant by "the angle contained by...the circumference CHA", I tried imagining the segment CHA and thus the angle contained by the line CA and BA or AE, but that didn't make any sense. After thinking on the text a bit longer I gave up and decided to search for the proposition and landed at this page (whose site I'd come across earlier) which explained that what Euclid was referring to was called a "Horn angle"; that is, Euclid was describing the angle made between a line and a curve. Nothing that I'd learned in geometry had prepared me for this; I'd always thought of angles as between straight lines, never between curves, hence I was totally blind-sided by the idea. The proposition now made sense, though, and I was lucky enough to not have to consider horn angles for the rest of my reading (so far).
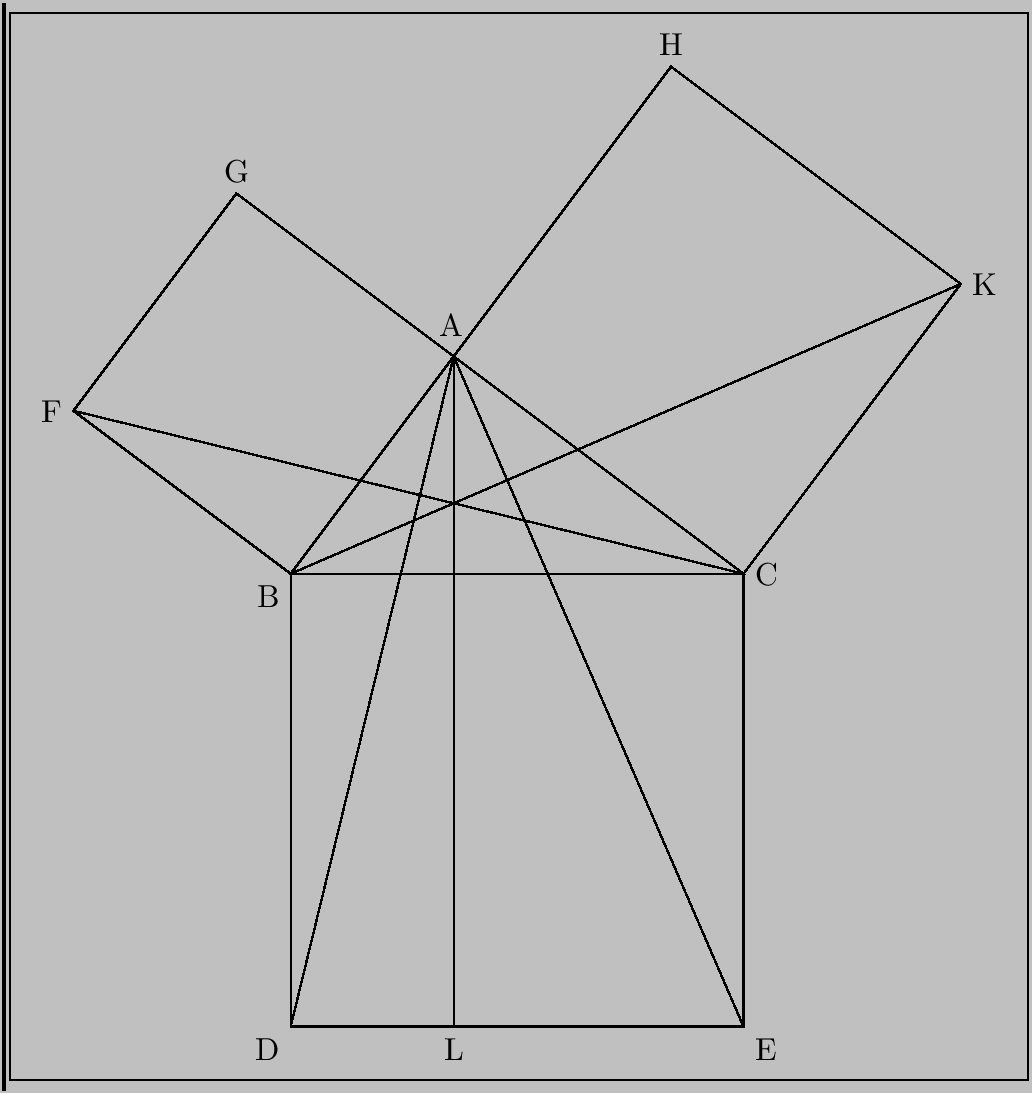
I first supplied -debug to the latex2html command-line and learned that the final part of the image processing involves running the pnmcrop, ppmquant, and then pnmtopng commands. Unfortunately, LATEX2html was cleaning the intermediate PNM, PS, and PNG files, but that was remedied by editing the latex2html file's cleanup function to simply return rather than perform clean-up. Looking at the intermediate files I then noticed that all of the PostScript and PNM files in fact had the same gray background, it was only the PNG images in which the background had (usually) become fully transparent. For example, here is how the graph relating to Book I, Proposition 47 looks like as a PNM (though it was converted to a PNG for posting's sake):
Looking closer at the commands showed that the -trans '#d9d9d9' option was being passed to pnmtopng, thus it seemed that the gray color was being used as a marker for what would become transparent in the final PNG image, but why wasn't it working for this problem image? I also took a look at the resulting files with the file command, naming one image "working" and the other "broken" after whether they rendered as per my expectation or not, respectively:works.pnm: Netpbm image data, size = 1032 x 1093, rawbits, pixmap broken.pnm: Netpbm image data, size = 643 x 518, rawbits, pixmap works.png: PNG image data, 1032 x 1093, 4-bit colormap, interlaced broken.png: PNG image data, 643 x 518, 8-bit grayscale, interlacedSo the broken image was being converted to a grayscale which had no alpha channel! I ran the command myself (pnmtopng -interlace -trans '#d9d9d9') in order to see if I could reproduce the output and, sure enough, ran into the same issue. I checked the man page for a workaround and noticed that by default the program would use a "nearby" color if the specified transparency color wasn't found, but I could append an = to the color in order to make it match exactly. When I tried this neither the working image nor the broken image had any transparency, and the previously-working image printed the warning pnmtopng: specified transparent color not present in palette; ignoring -transparent as well (the broken image did not print anything); strange that it should only warn for working image, presumably the broken one matched better, but then where was the transparency?! I figured it must not exist in grayscale images, as they must not have an alpha channel. At this point I decided to e-mail the soon-to-be-unfortunate program maintainer telling him that I'd run into a bug. In the meantime I figured out that I could set the fill color with
\definecolor{mycolor}{RGB}{192, 192, 192} to make it the same gray as the background and thus cause it to appear transparent as the other, "working", image was, but this workaround was still not satisfying.
The maintainer got back to me and told me that, in fact, the grayscale image does have transparency in it! Apparently, for images where a single color is designated as transparent, that information is encoded via something called a "tRNS chunk" rather than a separate alpha channel (thus saving space). He told me that I could check using either pngtopam -verbose > /dev/null or pngcheck -v. Doing so showed the following:
	File: broken.png (9153 bytes)
	  chunk IHDR at offset 0x0000c, length 13
	    643 x 518 image, 8-bit grayscale, interlaced
	  chunk tRNS at offset 0x00025, length 2
	    gray = 0x00d9
	  chunk IDAT at offset 0x00033, length 8192
	    zlib: deflated, 32K window, default compression
	    rows per pass: 65, 65, 65, 130, 129, 259, 259
	  chunk IDAT at offset 0x0203f, length 878
	  chunk IEND at offset 0x023b9, length 0
	No errors detected in broken.png (5 chunks, 97.3% compression).

	File: works.png (21851 bytes)
	  chunk IHDR at offset 0x0000c, length 13
	    1032 x 1093 image, 4-bit palette, interlaced
	  chunk PLTE at offset 0x00025, length 48: 16 palette entries
	  chunk IDAT at offset 0x00061, length 8192
	    zlib: deflated, 32K window, default compression
	    rows per pass: 137, 137, 137, 274, 273, 547, 546
	  chunk IDAT at offset 0x0206d, length 8192
	  chunk IDAT at offset 0x04079, length 5326
	  chunk IEND at offset 0x05553, length 0
	No errors detected in works.png (6 chunks, 96.1% compression).
So the broken image did indeed have a transparency value encoded as a tRNS chunk while the working image had a palette entry to designate transparency, but why wasn't it showing as transparent on the broken image? Were all the image viewers that I tried just buggy?
Then it occurred to me: does #d9d9d9 actually map onto an 8-bit grayscale? I opened the PNG image and noticed that the gray was actually #c0c0c0! So it had been downscaled, but, wait, it turned out to be the same value in the PNM image... and the PostScript image! Well, what created the PostScript image? That turned out to be a DVI file which contained all of the images, so it was a bit tricker to analyze. After digging in LATEX2html's source code though I eventually found that the background color was set via the variable $LATEX_COLOR which was by default \pagecolor[gray]{.7}. By setting this value myself in .latex2html-init to the expected transparency value with \pagecolor[RGB]{217, 217, 217} (the decimal equivalent of the hexadecimal value) and adjusting my workaround to also use said value (never mind that I didn't previously comprehend that I was using #c0c0c0 rather than #d9d9d9 when I first implemented the workaround) I could then generate a correct image! In addition, the warning that came from generating a PNG from the PNM file when using the exact transparency specification went away. Turns out the other images happened to work because pnmtopng was selecting the nearby color #c0c0c0 when it couldn't find #d9d9d9, but this nearness selection didn't happen when generating a grayscale image, thus causing my problem!
The problem root caused and solution found, I decided to check if there was anywhere I could submit a patch against LATEX2html. Checking my distribution's upstream it appeared that someone had actually taken on maintaining the program to some extent, as the original author, Nikos Drakos, was no longer maintaining it. Before submitting a patch I took a look at the newest version and noticed that a number of significant changes had been made, such as using pdflatex in order to generate images by default. Slightly daunted, I tried it out, but the results that I got had a black background for all images and made some other changes to the layout of the webpage that I was not particularly keen on. I tried tweaking the options based on a few of the commits but quickly ran out of patience; I was not trying to port my website to a new version of the tool with breaking changes and fix a bug, especially as I'd already dumped so much time into it already. Before quitting, though, I did notice a patch which appeared to address a similar issue. Fair enough then, it seemed the problem was already noticed and had a solution; too bad I didn't see it sooner!
Thus the great image conversion transparency saga of early 2019 came to an end. Hopefully my next blog attempt will run into fewer issues, sheesh!
My thanks to the Netpbm (pnmtopng) maintainer Bryan Henderson for his assistance.