 |
In this case my desire for offline data centered on map tiles; navigation and fancy search features I'd worry about later. The obvious choice for tiles was the OpenStreetMap project, though getting the tiles the way I wanted them ended up being a fair amount of effort. The first step was to determine a desktop program to use (and there are many to choose from) and play around with it. The next step was to get the data for Eugene, OR. Once I had the data I then had to generate the tiles, which was done by setting up a local webserver with the renderd daemon. With the server set up, I then spent a bit of time figuring out how to pull the tiles so that I wouldn't have to rely on a working webserver (useful for copying the tiles to other machines). Finally, I got the data for all of Oregon and generated tiles for the entire state. Though there were some rough spots, there was nothing insurmountable to achieving my goal.
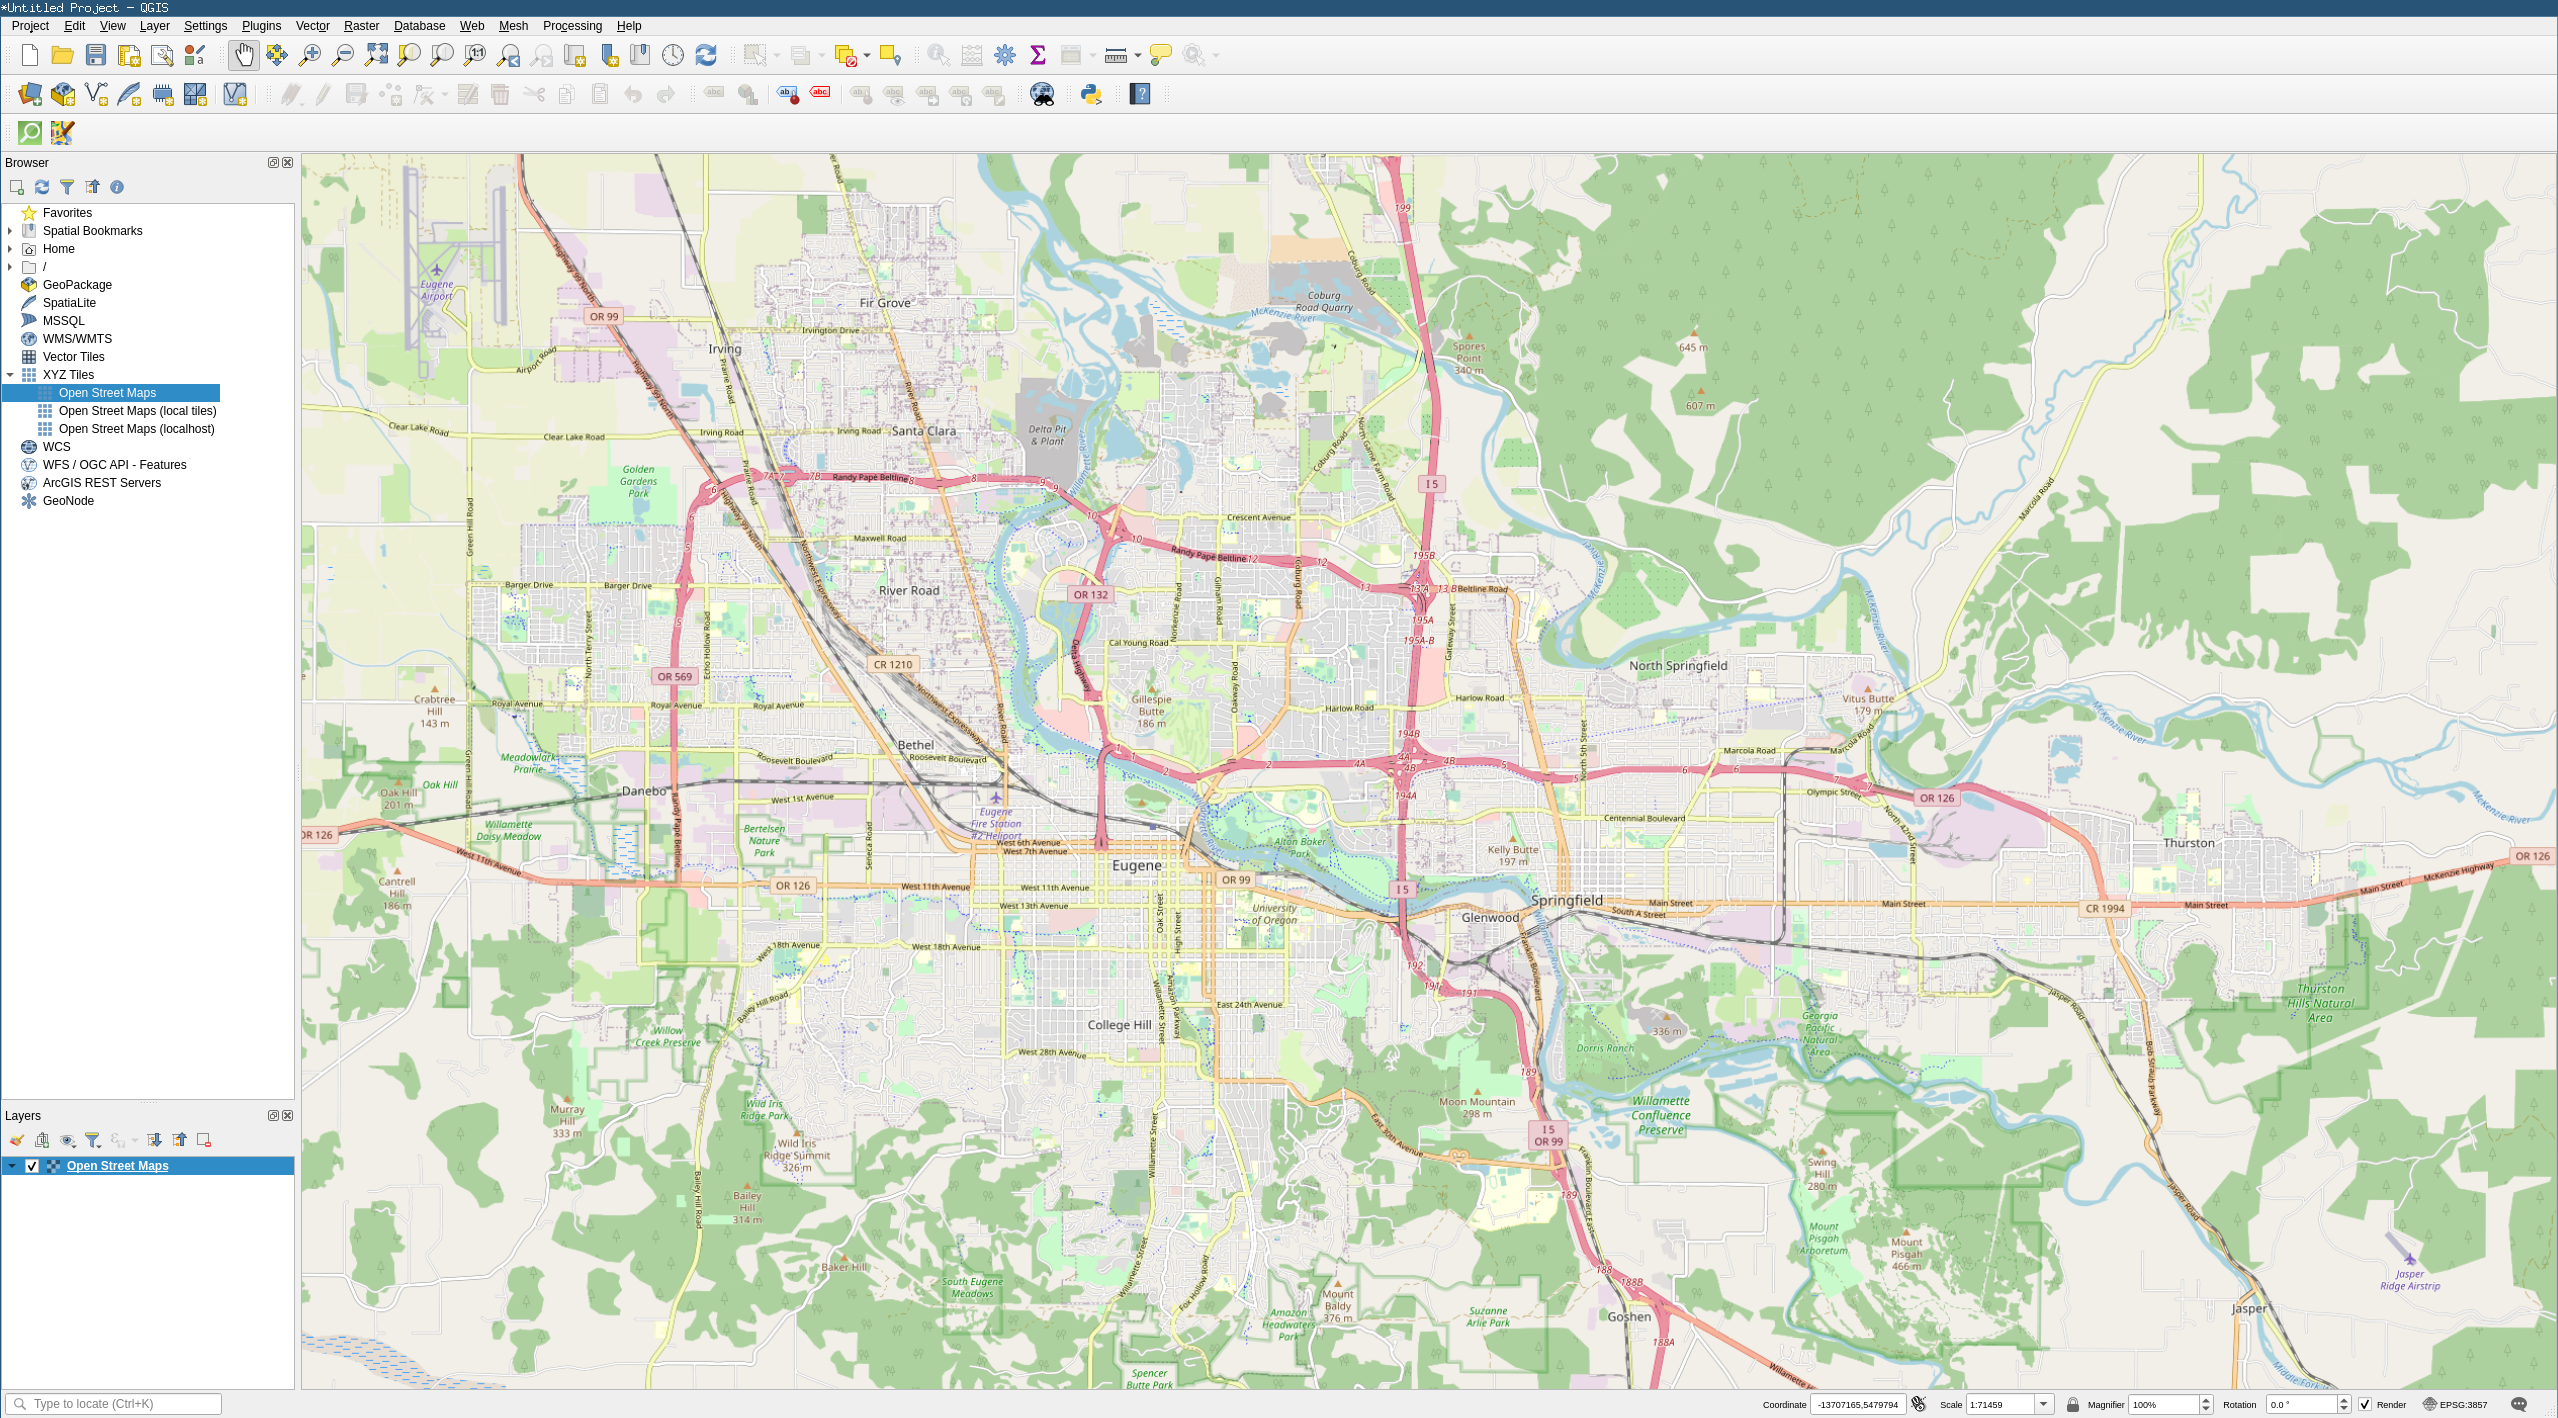
I began learning the tool by following the QGIS tutorial. After that I followed the instructions on the OSM QGIS Wiki page to add the OSM-provided tiles:
|
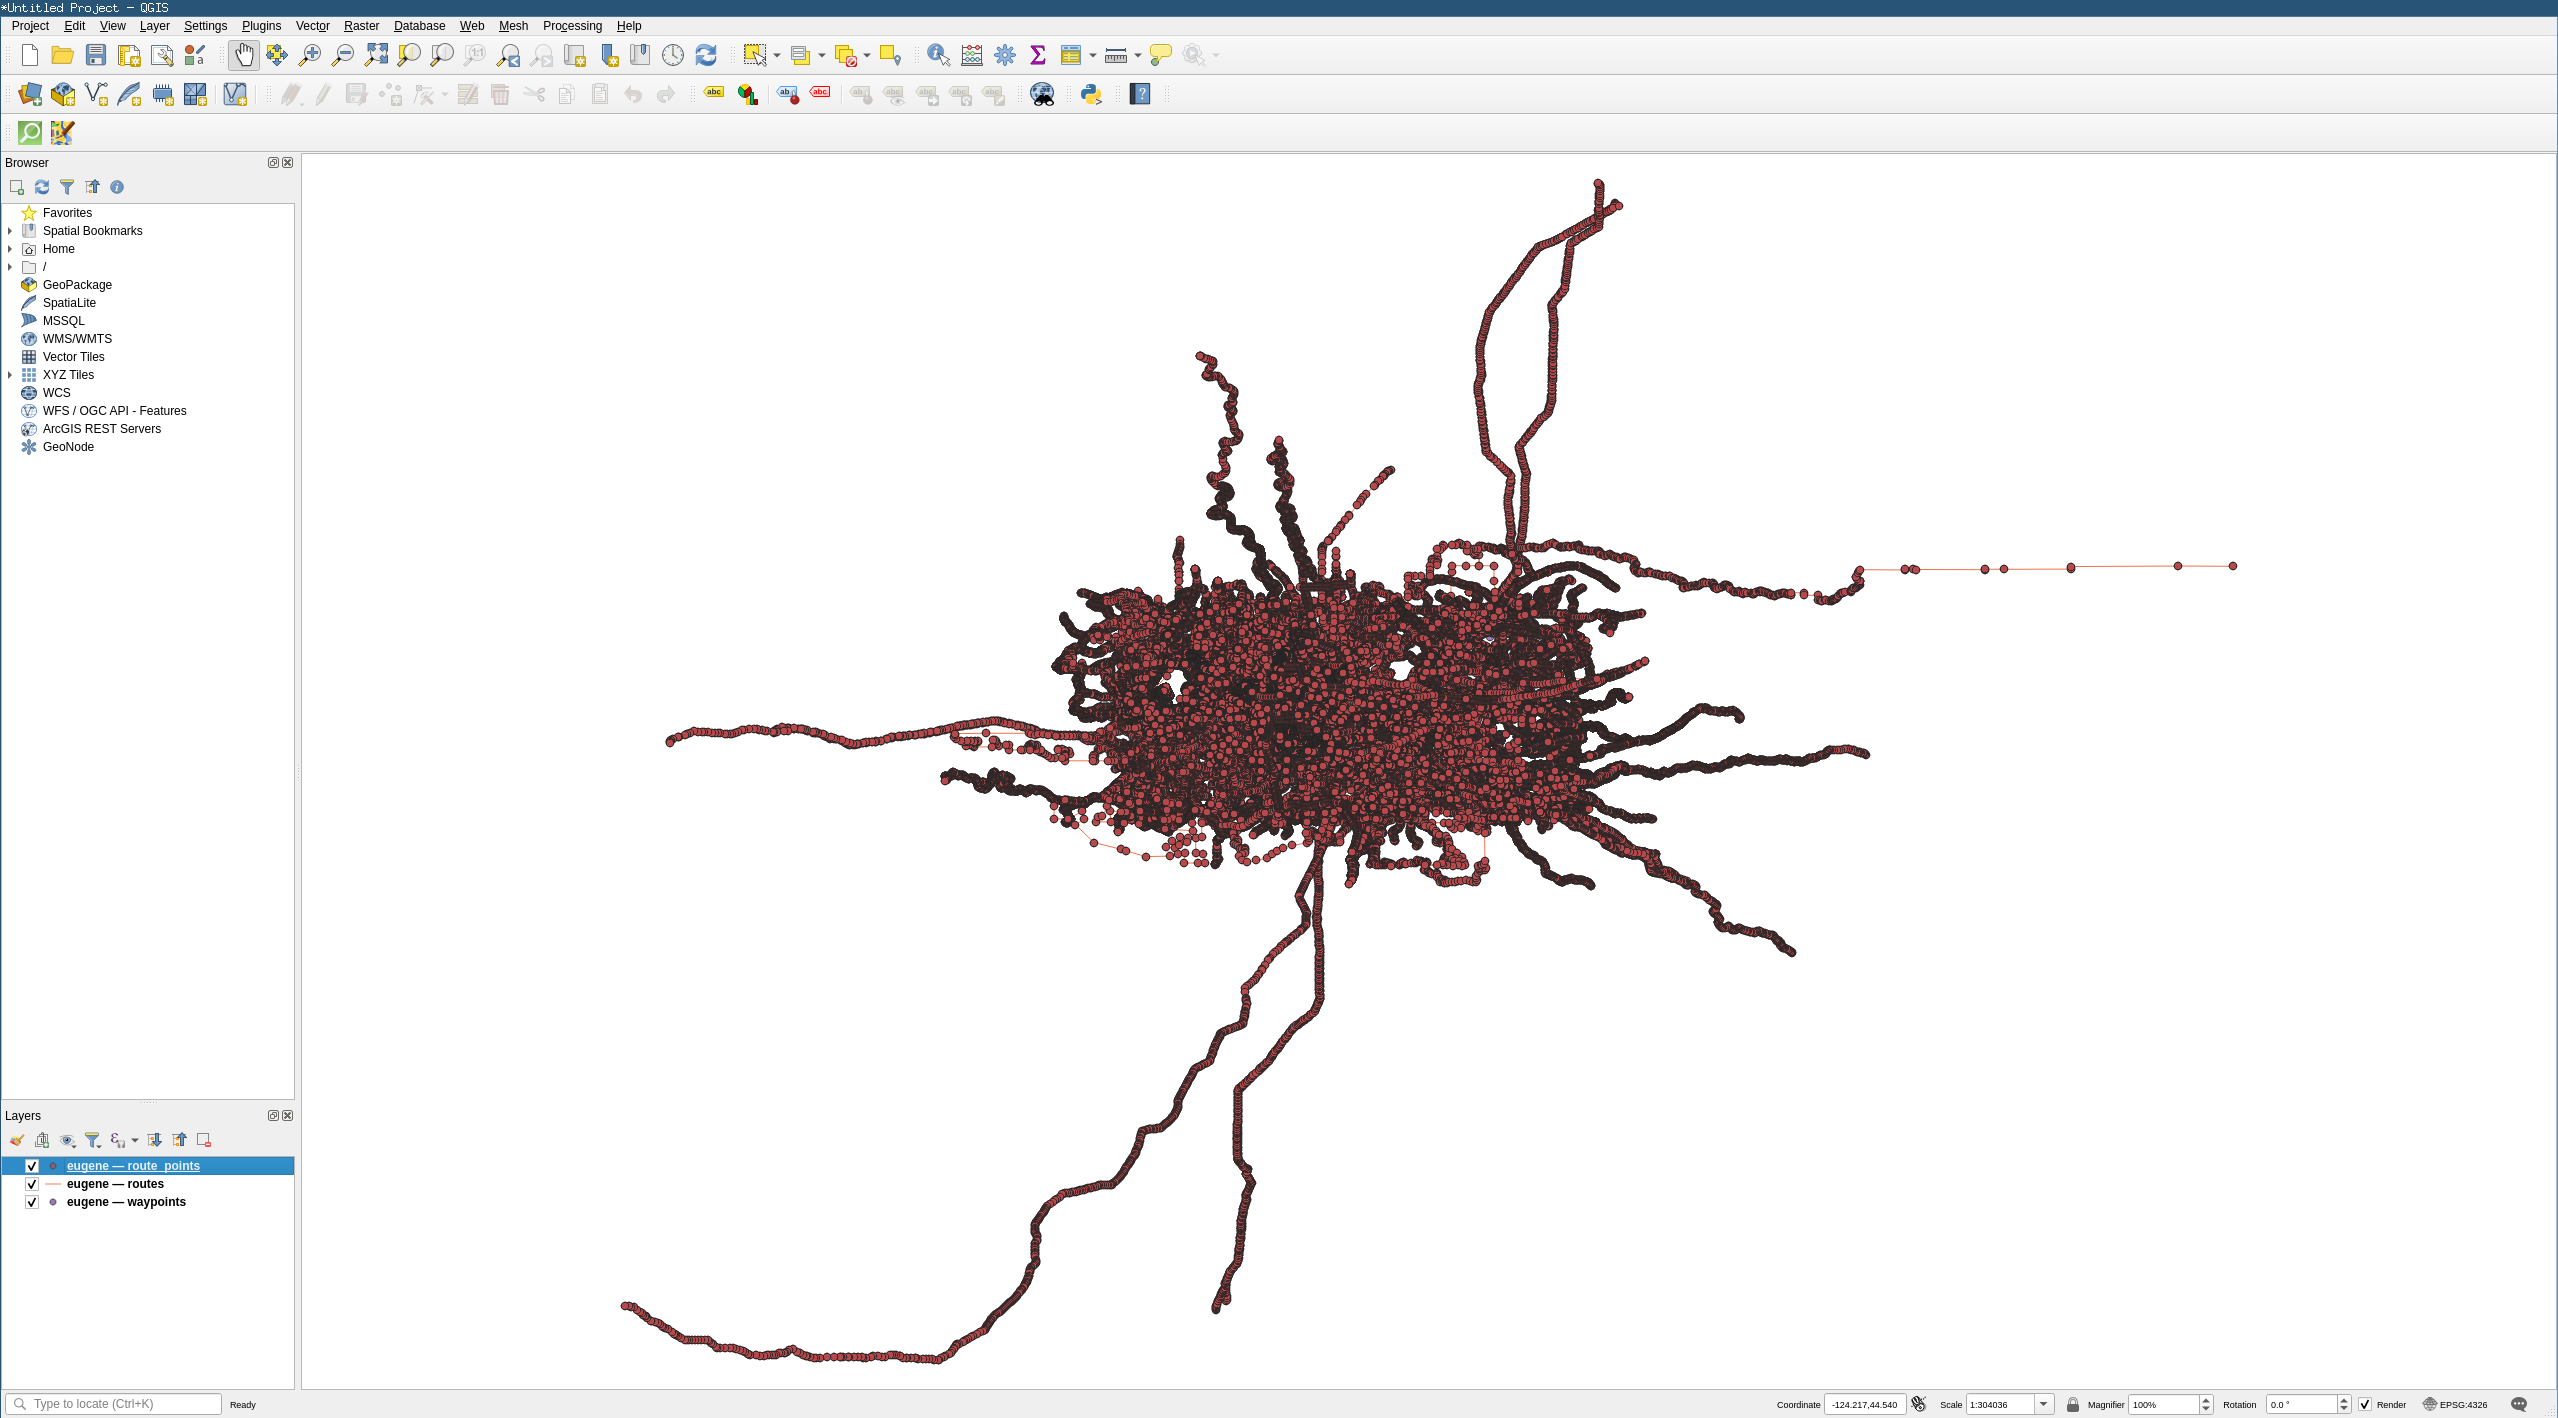
Personally, I think it looks pretty nice and has a surprising amount of detail! Being reliant on a remote server isn't what I wanted, however, so for the next step I looked into downloading the data for Eugene.
Yikes. It looks like some kind of lovecraftian horror. It also liked to crash QGIS, especially if I wasn't extremely gentle with my usage. What I had thus far wasn't anything close to the nice tiles I was getting from OSM; I needed to figure out how to get those tiles!
More precisely, I decided to follow the instructions for a Debian 11 tile server. Since I was on Gentoo, the instructions required a number of adaptations (though my notes aren't too good here, I'll document a few problems and their fixes as best I'm able to); I also made reference to these old Gentoo instructions and these mod_tile instructions for Ubuntu 20.04 when necessary. A few difficulties were encountered when installing the Mapnik Python bindings; first off:
# ./setup.py install
<snip>
src/mapnik_datasource.cpp:37:10: fatal error: mapnik/geometry/box2d.hpp: No such file or directory
   37 | #include <mapnik/geometry/box2d.hpp>
      |          ^~~~~~~~~~~~~~~~~~~~~~~~~~~
compilation terminated.
error: command '/usr/bin/x86_64-pc-linux-gnu-g++' failed with exit code 1

Missing boost_python boost library, try to add its name with BOOST_PYTHON_LIB environment var.
This was despite having Boost installed with the python USE flag enabled. So I searched for the installed Python library via equery f boost | grep -i python, found it at /usr/lib64/cmake/boost_python-1.77.0, and re-ran the command:
# BOOST_PYTHON_LIB=/usr/lib64/cmake/boost_python-1.77.0 ./setup.py install
<snip>
/usr/lib/gcc/x86_64-pc-linux-gnu/11.2.0/../../../../x86_64-pc-linux-gnu/bin/ld: cannot find -l/usr/lib64/libboost_python39.so
collect2: error: ld returned 1 exit status
error: command '/usr/bin/x86_64-pc-linux-gnu-g++' failed with exit code 1
Which then failed at a different point. Apparently BOOST_PYTHON_LIB expects the soname of the library and not the full path. Setting BOOST_PYTHON_LIB=boost_python39 fixed the issue.
Next, I had some issues getting the “external data” when setting up OSM Carto:
$ ./scripts/get-external-data.py
INFO:root:  Importing into database
CRITICAL:root:ogr2ogr returned 1 with layer simplified_water_polygons
CRITICAL:root:Command line was ogr2ogr -f PostgreSQL -lco GEOMETRY_NAME=way -lco SPATIAL_INDEX=FALSE -lco EXTRACT_SCHEMA_FROM_LAYER_NAME=YES -nln loading.simplified_water_polygons PG:dbname=gis data/simplified_water_polygons/simplified-water-polygons-split-3857/simplified_water_polygons.shp
CRITICAL:root:Output was
<snip>
subprocess.CalledProcessError: Command '['ogr2ogr', '-f', 'PostgreSQL', '-lco', 'GEOMETRY_NAME=way', '-lco', 'SPATIAL_INDEX=FALSE', '-lco', 'EXTRACT_SCHEMA_FROM_LAYER_NAME=YES', '-nln', 'loading.simplified_water_polygons', 'PG:dbname=gis', 'data/simplified_water_polygons/simplified-water-polygons-split-3857/simplified_water_polygons.shp']' returned non-zero exit status 1.

During handling of the above exception, another exception occurred:
<snip>
RuntimeError: ogr2ogr error when loading table simplified_water_polygons
Yikes. The next step here was to try running the command manually in order to get the actual process output:
postgres@seneca /home/frostsnow/software/openstreetmap-carto $ ogr2ogr -f PostgreSQL -lco GEOMETRY_NAME=way -lco SPATIAL_INDEX=FALSE -lco EXTRACT_SCHEMA_FROM_LAYER_NAME=YES -nln loading.simplified_water_polygons PG:dbname=gis data/simplified_water_polygons/simplified-water-polygons-split-3857/simplified_water_polygons.shp
ERROR 1: Unable to find driver `PostgreSQL'.
Hmm. I mapped the program ogr2ogr to its package with equery b $(which ogr2ogr), got sci-libs/gdal and noticed that the postgres USE flag was not enabled; enabling it and re-compiling fixed the issue.
Third, I had an issue configuring mod_tile:
$ ./configure
checking for /opt/local/apache2/bin/apxs... no
configure: error: Could not find apxs on the path.
...because I hadn't installed Apache yet. D'oh.
That wasn't enough to compile mod_tile, though, as I then ran into the following compilation issue:
$ make
depbase=`echo src/daemon.o | sed 's|[^/]*$|.deps/&|;s|\.o$||'`;\
gcc -DHAVE_CONFIG_H -I. -I./includes  -pthread -I/usr/include/glib-2.0 -I/usr/lib64/glib-2.0/include    -g -O2 -MT src/daemon.o -MD -MP -MF $depbase.Tpo -c -o src/daemon.o src/daemon.c &&\
mv -f $depbase.Tpo $depbase.Po
src/daemon.c:46:10: fatal error: iniparser/iniparser.h: No such file or directory
   46 | #include <iniparser/iniparser.h>
      |          ^~~~~~~~~~~~~~~~~~~~~~~
compilation terminated.
make: *** [Makefile:887: src/daemon.o] Error 1
Step one was to install iniparser, but I still got the same error. Turns out that iniparser.h was located in the iniparser4 directory, so I had to change iniparser/iniparser.h to iniparser4/iniparser.h. I got a similar error during linking: /usr/lib/gcc/x86_64-pc-linux-gnu/11.2.0/../../../../x86_64-pc-linux-gnu/bin/ld: cannot find -liniparser which was solved by editing Makefile to use -liniparser4. Hardly a proper fix, but effective enough to move on.
Then I had trouble starting Apache:
# rc-service apache2 restart
 * apache2 has detected an error in your setup:
AH00526: Syntax error on line 7 of /etc/apache2/modules.d/11_mod_tile.conf:
Invalid command 'ModTileTileDir', perhaps misspelled or defined by a module not included in the server configuration
The solution here was to explicitly load the tile module via opening /etc/apache2/httpd.conf and adding the line LoadModule tile_module modules/mod_tile.so.
Even though I had Apache running at this point, I wasn't able to view any tiles. I found the source of the problem by opening /var/log/apache2/error_log and finding the following log message:
[Sat Jan 29 18:12:49.629646 2022] [tile:warn] [pid 22362] [client 127.0.0.1:38558] socket connect failed for: /run/renderd/renderd.sock with reason: No such file or directory
[Sat Jan 29 18:12:49.629675 2022] [tile:notice] [pid 22362] [client 127.0.0.1:38558] Failed to connect to renderer
The easiest workaround (and bad; don't try this at home) was to set chmod 0777 on the file; this worked, and I made a note to fix it later.
Eventually I got everything set-up and tried out the sample leaflet. At first I saw the outlines of all the continents and was worried that somehow external data was being pulled in, but then I remembered that some extra data was pulled in magically by one of OSM's scripts earlier. As I zoomed into Oregon, I saw it:
Hurrah! For convenience's sake I then wrote a few OpenRC scripts so that I didn't have to manually invoke Apache, PostgreSQL, and renderd; /etc/init.d/renderd:
#!/sbin/openrc-run
# Copyright 2022 Gentoo Authors
# Distributed under the terms of the GNU General Public License v2

name="renderd daemon"
description=""
command=/usr/local/bin/renderd
command_args="${renderd_args}"
command_user=postgres:postgres

depend() {
        need apache2 postgresql-13
}

start_pre() {
        checkpath -d --owner root:postgres --mode 0775 /run/renderd
}
and /etc/conf.d/renderd:
# /etc/conf.d/minetest-server: config file for /etc/init.d/minetest-server

# pidfile
PIDFILE="/run/renderd/renderd.pid"
Yes, I used the postgres user for anything involving renderd. A proper set up would decouple the two, but renderd was the only thing using PostgreSQL so it didn't seem like a big deal and I didn't want to bother creating another user.
As for QGIS, pulling from the local webserver was simple enough: create a new XYZ tiles layer and set it's Layer Source URL to http://127.0.0.1/hot/{z}/{x}/{y}.png. Although (sadly) a little slower than pulling from OSM's server, it worked!
import math
def deg2num(lat_deg, lon_deg, zoom):
  lat_rad = math.radians(lat_deg)
  n = 2.0 ** zoom
  xtile = int((lon_deg + 180.0) / 360.0 * n)
  ytile = int((1.0 - math.asinh(math.tan(lat_rad)) / math.pi) / 2.0 * n)
  return (xtile, ytile)
Though renderd_list wasn't co-operating when I invoked it:
** (process:10517): ERROR **: 19:04:08.262: init_storage_backend: No valid storage backend found for options: s2o/
Failed to initialise storage backend s2o/
It turned out that I needed to pass the tile cache directly via -t /var/lib/mod_tile. The program then ran, but did nothing. Argh! Eventually I searched /var/log/messages and found the following:
Feb 12 19:06:01 seneca renderd[2618]: ERROR: No map for: default
The fix here was to explicitly tell the program to use the s2o map via -m s2o. Now the tiles were rendering!
Unfortunately for me, the renderd tiles were stored on-disk in a special layout that was mapped to the appropriate pages by the Apache module but was not suitable for direct file access! Some digging in the source showed a man page for a convert_meta utility, though it was not installed on my system. This utility appeared to have been written primarily to convert from a “plain” format (which I wanted) to renderd's special format; it also appeared to be able to convert from the special format back to a plain format. I tried my hand at enabling and compiling this utility but was not at all successful; it seems to have long been bit-rotted. Instead, I ended up writing a dumb script to pull all the tiles I needed:
#!/bin/bash

# No nested arrays in bash, so manually ensure these line-up.
# Eugene.
zooms=(11 12 13 14 15 16 17 18)
xmins=(322 645 1291 2582 5165 10331 20663 41327)
xmaxs=(325 650 1300 2601 5202 10404 20809 41618)
ymins=(743 1487 2974 5948 11897 23794 47589 95178)
ymaxs=(744 1489 2979 5958 11917 23835 47671 95343)
dest="media/tiles"

set -x
mkdir -p "${dest}"
pushd "${dest}"
for (( i=0 ; i<${#zooms[@]} ; i++ )); do
        zoom=${zooms[$i]}
        xmin=${xmins[$i]}
        xmax=${xmaxs[$i]}
        ymin=${ymins[$i]}
        ymax=${ymaxs[$i]}

        # Render tiles.
        #render_list -z ${zoom} -Z ${zoom} -a -x ${xmin} -X ${xmax} -y ${ymin} -Y ${ymax} -t /var/lib/mod_tile -f -m s2o

        # Pull tiles.
        mkdir -p "${zoom}"
        pushd "${zoom}"
        for (( x=${xmin} ; x<=${xmax} ; x++ )); do
                mkdir -p "${x}"
                pushd "${x}"
                for (( y=${ymin} ; y<=${ymax} ; y++ )); do
                        wget -c "http://localhost/hot/${zoom}/${x}/${y}.png"
                done
                popd
        done
        popd
done
set +x
As I said, it's pretty dumb: a real script would do something like accept an extent and then dynamically calculate the co-ordinates, but I didn't feel like figuring out all the trigonometry in bash, bc, or calling out to an inline Python script. It also probably doesn't need the render_list call since the webserver will just dynamically generate any missing tiles. There's also probably a sane way to make multiple calls to wget so it doesn't send a bajillion separate connections. Anyways, awfulness aside, the script did work to pull all of the tiles over about 5-10 minutes! The data took up about 366MB; a very reasonable amount!
...but would QGIS be able to use the local tiles? While the Layer Source's URL parameter should accept a perfectly valid file:// URL, that didn't mean that it'd actually work. I was able to save the layer, but when I opened it again and double-checked its properties the URL entry was blank! I entered and saved it again, and got the same result! Yet, when I actually tried navigating in the map, it worked! It was fast, too. So, apparently the user interface didn't understand the URL, but the underlying library sure appeared to.
Local tiles for Eugene in hand, I had the cornerstone of what I was looking for and a basis to build upon. The tiles were currently limited to Eugene, and I decided it'd be nice to have tiles for all of Oregon in case I needed to travel somewhere in-state.
One of the entries on the Learn OSM getting data page listed GeoFabrik extracts. All of North America was available at 11.3GB. Drilling down, I found US Pacific, er, but that was only 129MB while what I'd downloaded for Eugene earlier was 233MB; perhaps this was just Hawaii or something and not the U.S. Pacific timezone area? US West seemed then a more likely candidate, but I could do without California and Washington (and not just in a data sense). Thankfully, ignoring the “Special Sub Regions” section and instead looking at the “Sub Regions” section and choosing the United States of America had its own special Oregon sub-region at 178MB (presumably smaller than Eugene's 233MB because Eugene's file format was OSM while this was OSM PBF), perfect! A quick download and database update later it was then time to begin tile-generation.
The basics of generating tiles were pretty much the same as with Eugene, except I used the approximate extent for Oregon -126.2197,41.9052:-114.9559,46.3326 and a max zoom level of 7:
zooms=(7 8 9 10 11 12 13 14 15 16 17 18)
xmins=(19 38 76 152 305 611 1223 2447 4895 9790 19580 39161)
xmaxs=(23 46 92 185 370 740 1480 2960 5920 11840 23681 47363)
ymins=(45 90 181 362 725 1451 2903 5806 11613 23227 46455 92911)
ymaxs=(47 95 190 380 760 1521 3043 6087 12175 24351 48702 97405)
The first thing I noticed was that generating this set of tiles was taking much longer. By which I mean that generating Eugene's tiles seemed to take a little over 5 minutes while Oregon's took about a week. The amount of generated data was huge: 198G of raw tiles and 35G in renderd's cache (note: the latter may be an underestimate as the large amount of data generated may have triggered auto-cleaning mechanisms in renderd). Well, that's not exactly what I'd call practical. Pre-generating tiles for a city is thus feasible, but at the state level one would want to dynamically generate tiles or use some kind of heuristic to only generate tiles for their target areas.